- Global Buhmwoo
Global Buhmwoo
- Industries Served
- Social Responsibility
Social Responsibility
- PR
PR
 Language
Consumer Goods
 >
Industries Served > BEX-INTER CORPORATION > Overview
Overview
Balance Sheet
Unit one thousand won
| Balance | 2017 | 2016 |
|---|---|---|
| Asset | 82,398,743 | 79,651,573 |
| Current Asset | 10,641,030 | 8,589,893 |
| Quick Asset | 8,962,584 | 6,830,288 |
| Inventory | 1,678,446 | 1,759,605 |
| Non-current Asset | 71,757,713 | 71,061,681 |
| Investments | 69,810,734 | 69,061,681 |
| Tangible Assets | 1,558,609 | 1,624,514 |
| Intangible Assets | 47,181 | 55,534 |
| Other Non-current Assets | 341,189 | 341,189 |
| Liabilities | 24,621,794 | 25,137,504 |
| Current Liabilities | 11,176,298 | 28,891,618 |
| Long-term Liabilities | 13,445,495 | 3,245,887 |
| Stockholder's Equity | 57,776,949 | 54,514,069 |
| Capital Stock | 1,535,950 | 1,535,950 |
| Capital Surplus | 1,237,810 | 1,267,810 |
| Accumulated Other Comprehensive Income | -467,361 | 473,787 |
| Net Income | 55,440,551 | 51,236,523 |
Profit/Loss(P/L)
Unit one thousand won
| Profit / Loss | 2017 | 2016 |
|---|---|---|
| Sales | 22,510,214 | 20,983,619 |
| Cost of Sales | 15,852,842 | 14,817,779 |
| Gross Mrgin | 6,667,372 | 6,165,841 |
| Selling Expenses & Administrative Expenses | 3,600,536 | 4,969,577 |
| Operating Income | 3,066,835 | 1,196,264 |
| Non-operating Income | 4,497,399 | 5,712,827 |
| Non-operating Cost | 2,187,447 | 2,069,672 |
| Income Before Tax Expenses | 5,376,788 | 4,839,418 |
| Corporation Tax | 559,588 | 332,623 |
| Net Income | 4,817,199 | 4,506,795 |
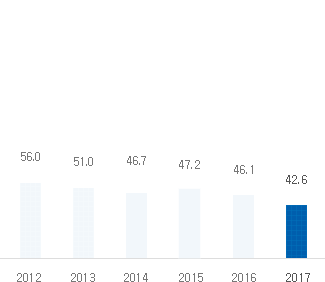
Liability-to-equity ratio(%)

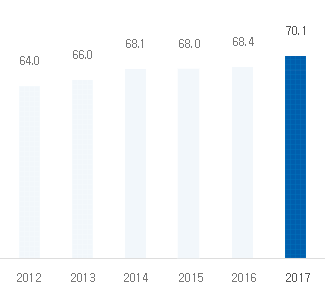
Capital adequacy ratio(%)

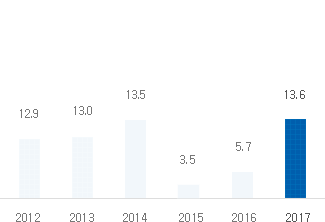
Operating Profit ratio(%)

Credit Rating
| Credit Rating Agency | NICE Information Service | BB+ |
|---|


